Program Locations:
Main Site, K-6:
Monday – Thursday 3:15 pm – 5:15 pm
Monday – Thursday 3:15 pm – 5:15 pm
No program when public school is either dismissed early or closed.
After-School Program Community Need
Local Need
- Poverty rates for the school district show the Jefferson School area to have the highest poverty rate in Muscatine with 84% of the 350 Jefferson families eligible for free and reduced meals in this low-income neighborhood. (Source: Annual State of Education Report 2009. Iowa Department of Education)
- 100% of the children enrolled have no other free after-school program in their school’s neighborhood.
- Muscatine School District is currently averaging an 85% graduation rate.

Community Cost of High School DropOuts
The potential cost savings for the community per student who does not drop out of school annually for 40 years is $300,000. This cost is based on lower welfare rates, criminal justice, and health care for the taxpayers. The potential for each student who completes four years of post-secondary over non-high school graduation is $2,500,000 of additional lifetime income. The potential cost savings for the school district in raising its graduation rate is $8,000 per at-risk student per year. The potential for the increase in the quality of a literate contributing community member living outside of poverty is inestimable.
After-School Program Results
- Students at the Flickinger Learning Center are improving their mathematics scores at a rate approaching 19% more than comparable non-Flickinger students and 10% in DIBELS (Dynamic Indicators of Basic Early Literacy Skills) raw words per minute reading abilities. For all about DIBELS, click here.
- The number of individual students served during 2012 was 85, averaging 42 students per day, five days per week. The children served were in Kindergarten through 5th grade. One hundred percent of the children served are from Muscatine. Jefferson School accounts for 70% of the students attending and 20% are from Washington School.
Muscatine Community School District says: (in the 2015-2016 school year), Flickinger Learning Center provided afterschool programming at Franklin Elementary to 13 students identified as at risk (based on two or more indicators) and were below benchmark on reading. Data showed that:
- In the fall, the students read on average 31 words per minute. By spring, they averaged 80 words per minute.
- One 2nd grade student began the fall reading only 11 words per minute. By the spring, this student was reading 109 words per minute.
- 3 students had behavior concerns in the classroom. After participating in the program, their frustration level decreased significantly, their peer relationships improved, and they were more engaged in the classroom.
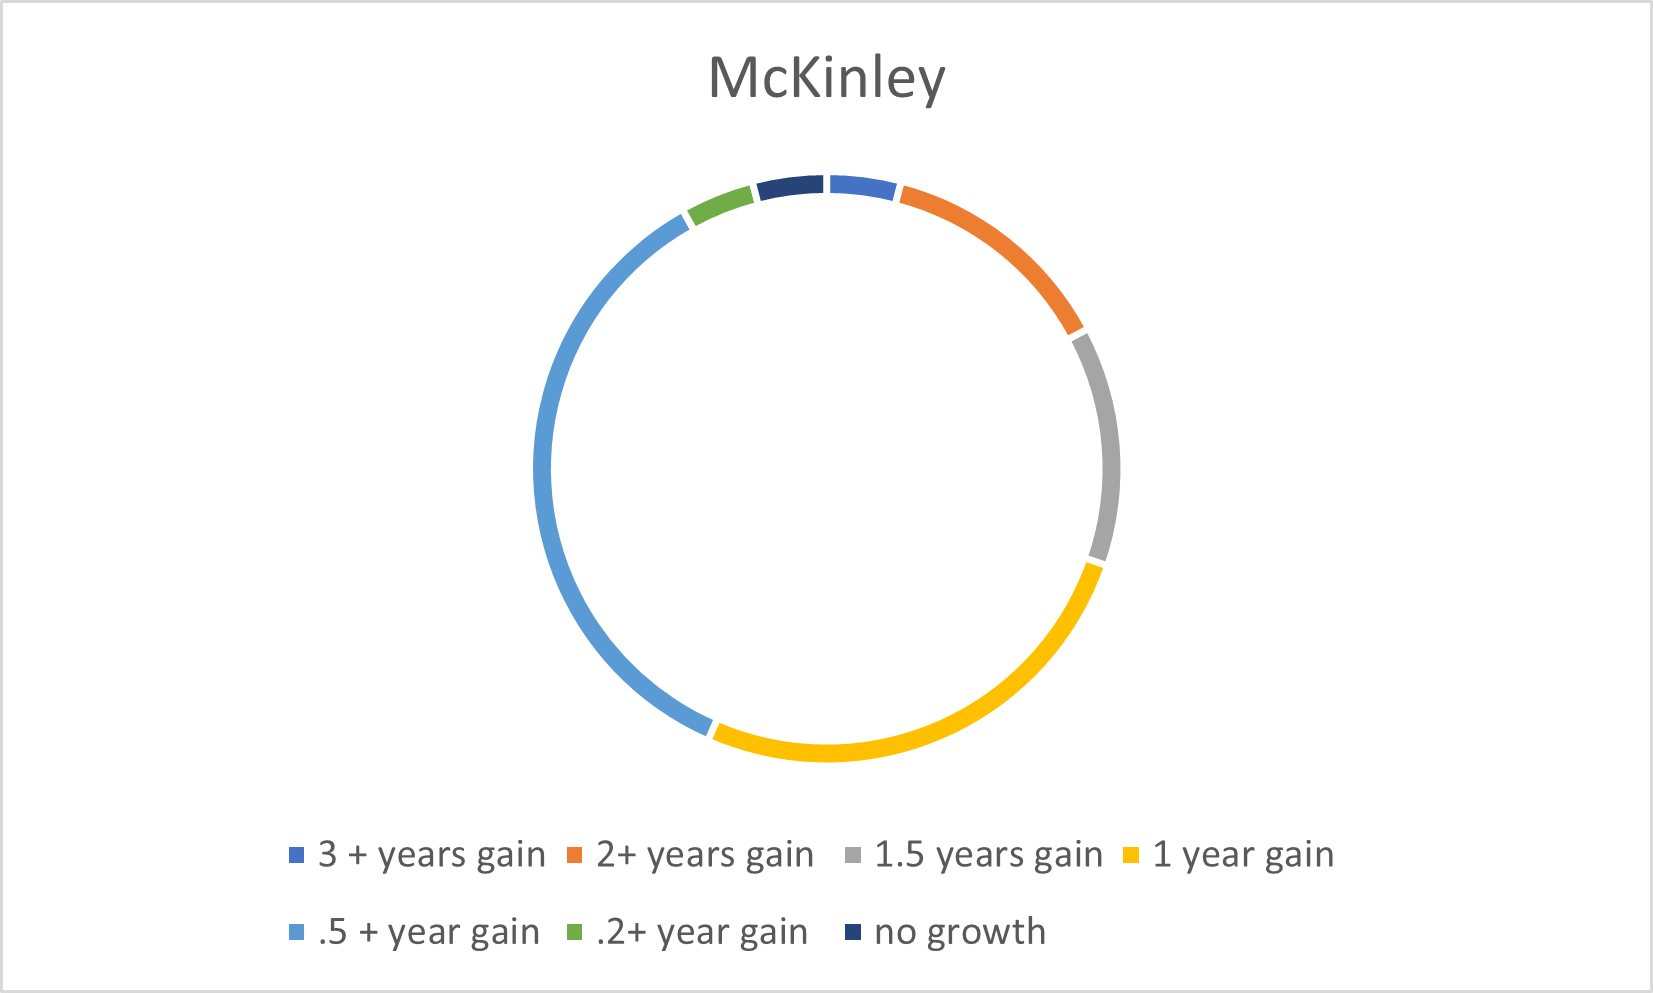
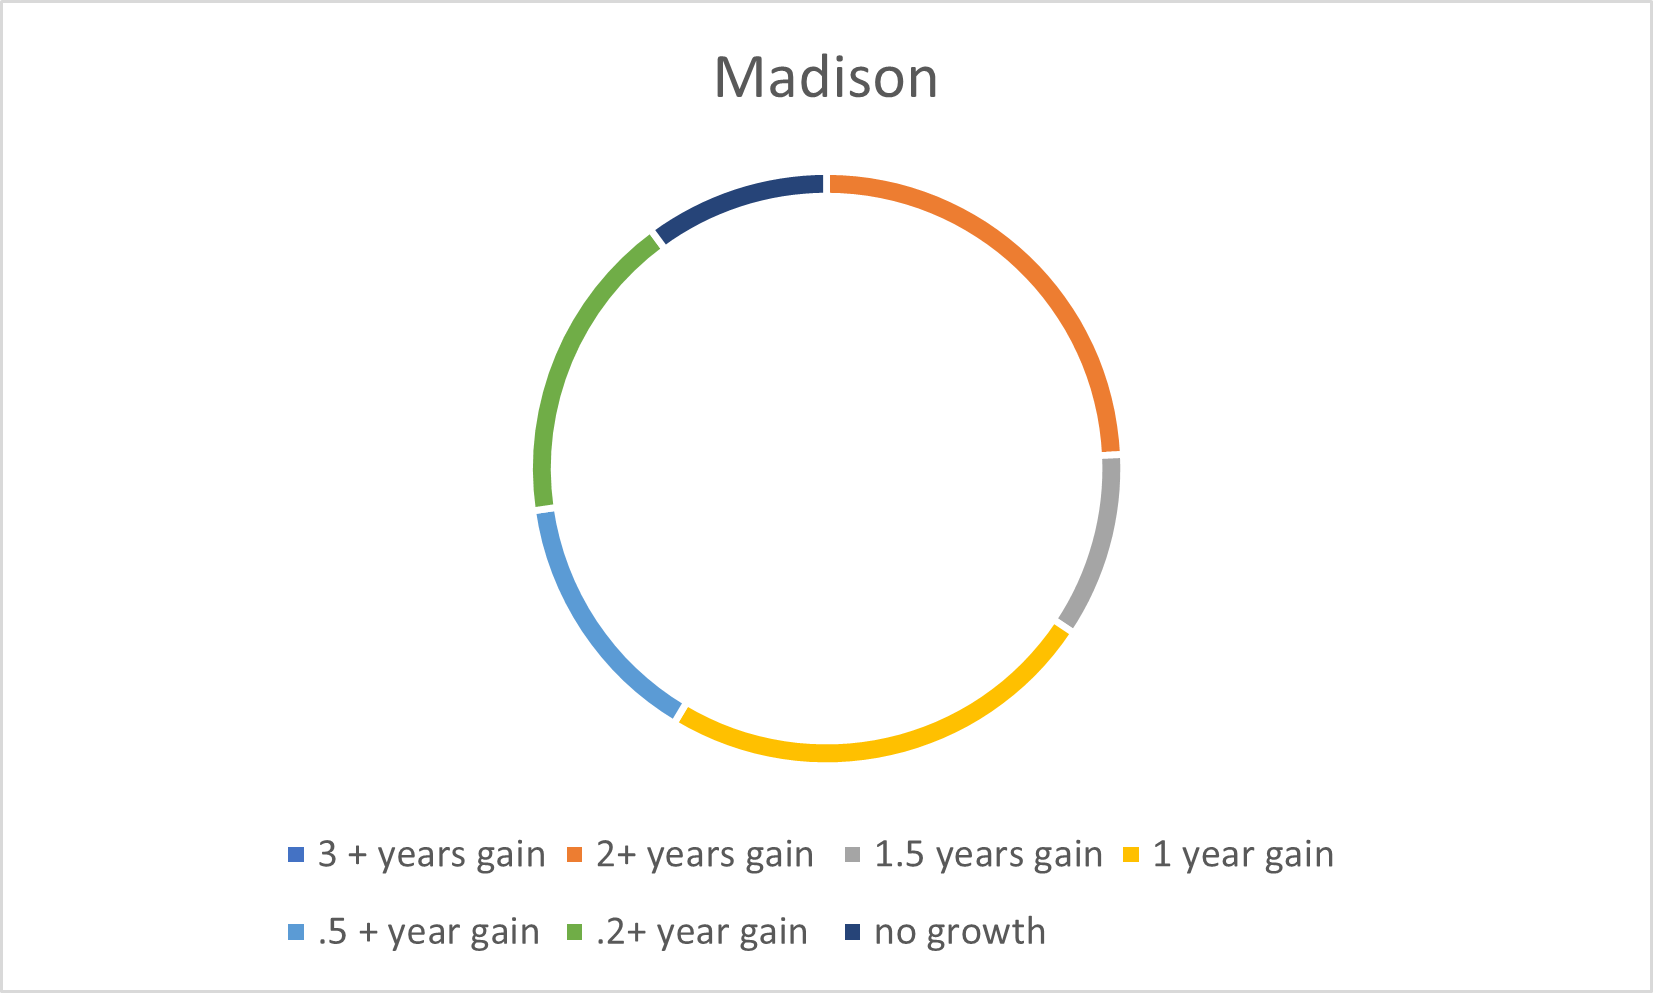
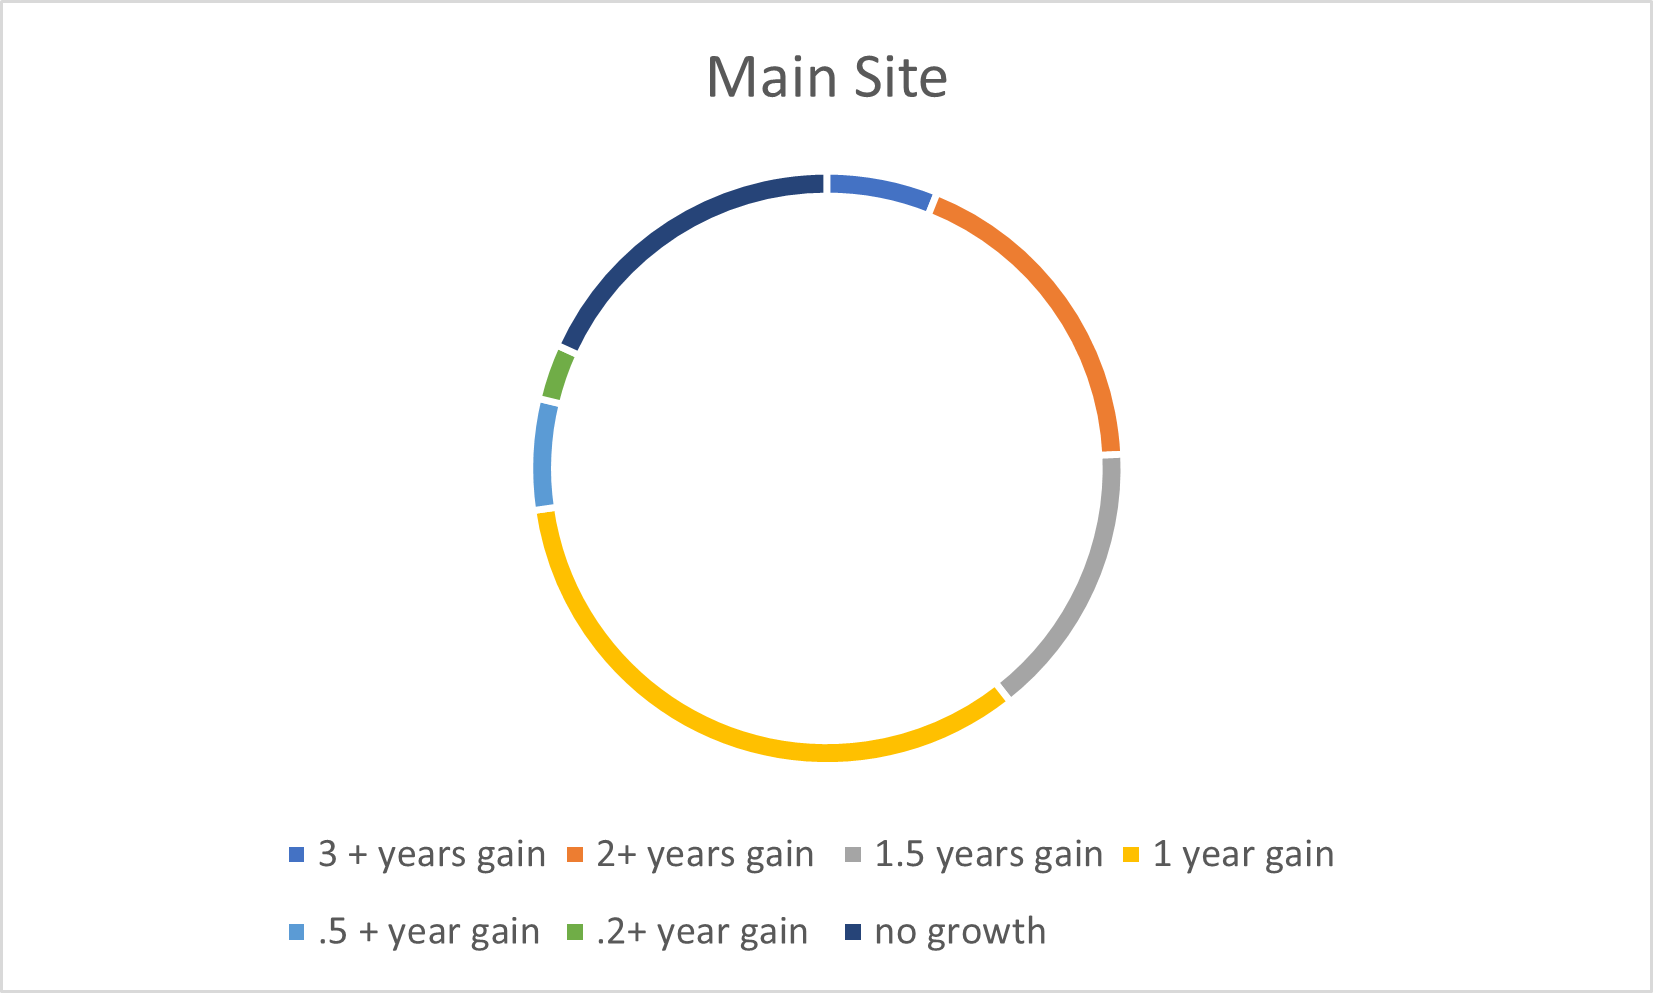
2021-2022 School Year Accelerated Reading Program Results, showing reading growth relative to standard reading level
Our 2022/23 funded cost per student is $1635. This figure is calculated by dividing our total operating expenses by the total number of students served during a program year. We receive tens of thousands of dollars in non-cash contributions annually from local businesses and community members that help keep the cost per student low.